Human-Computer Interaction & Information Visualization
SpatialVis:
Web-based Visualization System for Analyzing Logged Spatial
Interaction Data
January 2015 – April 2015
Technologies: D3.js, JavaScript, HTML/CSS, Processing, Leap Motion
SpatialVis: Visualization of Spatial Gesture Interaction Logs
Logging Interactive Visualizations & Visualizing Interaction Logs Workshop
at the IEEE VIS 2016 Research Conference
A common practice in interface design and development is to log the
associated input and event data for future analysis to help refine
the design and fix software bugs. Most often, this data is textual
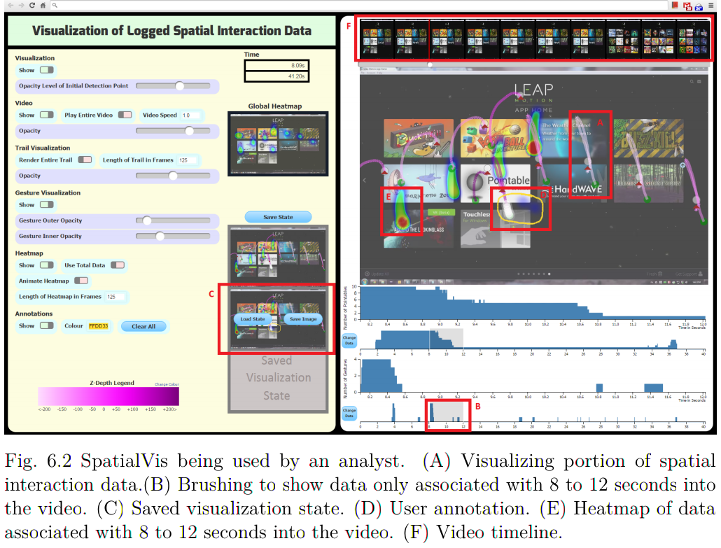
which makes it difficult to analyze. To mitigate this problem, I
developed a web-based application that takes this information and
visualizes it for the analyst. Specifically designed for spatial
interaction data, also known as mid-air gestures, the application
temporally and positionally visualizes event and 3D interaction data
over a video screen capture of the associated display to see their
effects on the graphical user interface.
Features:
Gesture & Event Visualizations, Heatmaps, Interaction Graphs
+ Brushing & Linking, Saving & Loading Visualization
States, Video Timeline, User Annotation, etc.

